本文目的
涉及计算机编程的所有相关内容。以C语言为核心。包括C语言相关知识、编译过程、汇编、运行过程、GDB调试技巧等内容。是对C语言笔记的补充
概念区分
暂无
C语言
遇到过的问题
全局变量是否应该初始化
全局变量默认初始为0,但是需要注意的是,如果有两个地方定义的同名的全局变量,但一边手动初始化,另一边没有手动初始化,编译时却不会报错。如果希望报错,需要给编译器加选项-fno-common。例如:
1
2
3
4
5
6
7
8
9
10
11
12
13
14
15
16
17
18
19
20
21
22
23
24
25
/* module_a.c */
#include <stdio.h>

void function(void);

int global = 0;

int main()
{
    global = 3;
    function();
    printf("main: %d \n", global);
    return 0;
}
/* module_b.c */
#include <stdio.h>

int global;

void function(void)
{
    global = 6;
    printf("function: %d \n", global);
    return 0;
}
因此,答案是可以不手动初始化,但必需使用编译选项-fno-common
更多信息参见为什么全局变量一定要初始化?_aiduan6474的博客-CSDN博客
结构体对齐
结构体对齐__attribute__((__aligned__(a))),如果a为64,表示64字节对齐,即sizeof(结构体)=N*64。
0长数组
数组 vs 指针
c语言:char a[1];(常量) vs char *a;(变量)
warning: implicit declaration of function ‘isxdigit’
直接在.c文件中添加:
1
include <ctype.h>
或者:
1
extern int isxdigit(int c);
或者:
1
int isxdigit(int c);
声明vs定义
declaration - Declaring functions and variables multiple times in C++ - Stack Overflow
随机数
参见man srand中的EXAMPLE
assert
extern
代码格式化
-
clang-format
-
astyle
静态代码分析
-
tscancode
-
clang中的scan-build
单元测试
TODO
预处理
- gcc -E(预处理)输出内容解读:Preprocessor Output - The C Preprocessor
编译
clang
-
JSON Compilation Database Format Specification — Clang 13 documentation
-
How To Setup Clang Tooling For LLVM — Clang 13 documentation
gcc
遇到过的问题
-
c++ - How to tell where a header file is included from? - Stack Overflow:gcc -M和-H参数
-
#warning有时不好使?原因未知,但应和gcc参数有关·
-
gcc - C preprocessor: expand macro in a #warning - Stack Overflow
汇编
风格(AT&T vs intel)
gdb:
1
set disassembly-flavor att |intel
objdump:
1
objdump -M intel|att -d a.out >a.s
X86
8086
学习资源:
-
大学课件
-
个人博客:16位汇编程序设计
x86_i86(IA-32)
普林斯顿大学课程资源:
-
主页(含参考资料):COS 217, Spring 2011: General Information
其他:
-
IA-32 Intel® Architecture Software Developer’s Manual, Volume 1: Basic Architecture
-
IA-32 Intel® Architecture Software Developer’s Manual, Volume 2: Instruction Set Reference
x86_64
在学习了前2者的前提下可自行摸索
ARM64
ARMv8
普林斯顿大学课程资源:
其他:
关于普林斯顿:
分析案例
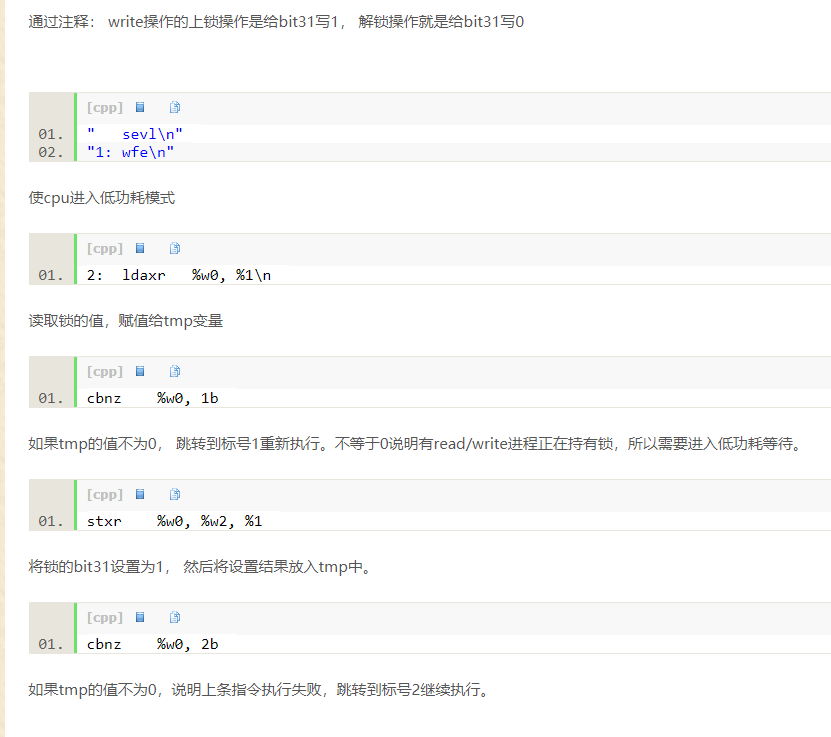
怀疑是锁函数(arch_write_lock)导致的内存越界访问,修改了不该修改的内存。以下是该函数的代码:
1
2
3
4
5
6
7
8
9
10
11
12
13
14
15
static inline void arch_write_lock(arch_rwlock_t *rw)
{
	unsigned int tmp;

	asm volatile(
	"	sevl\n"
	"1:	wfe\n"
	"2:	ldaxr	%w0, %1\n"
	"	cbnz	%w0, 1b\n"
	"	stxr	%w0, %w2, %1\n"
	"	cbnz	%w0, 2b\n"
	: "=&r" (tmp), "+Q" (rw->lock)
	: "r" (0x80000000)
	: "memory");
}
以及GDB反汇编结果:
1
2
3
4
5
6
7
8
9
10
11
12
13
14
15
16
17
18
Dump of assembler code for function arch_write_lock:
   0x0000000001bd036c <+0>:     sub     sp, sp, #0x20
   0x0000000001bd0370 <+4>:     str     x0, [sp, #8]
   0x0000000001bd0374 <+8>:     ldr     x2, [sp, #8]
   0x0000000001bd0378 <+12>:    mov     w1, #0x80000000                 // #-2147483648
   0x0000000001bd037c <+16>:    ldr     x0, [sp, #8]
   0x0000000001bd0380 <+20>:    sevl
   0x0000000001bd0384 <+24>:    wfe
   0x0000000001bd0388 <+28>:    ldaxr   w3, [x2]
   0x0000000001bd038c <+32>:    cbnz    w3, 0x1bd0384 <arch_write_lock+24>
   0x0000000001bd0390 <+36>:    stxr    w3, w1, [x2]
=> 0x0000000001bd0394 <+40>:    cbnz    w3, 0x1bd0388 <arch_write_lock+28>
   0x0000000001bd0398 <+44>:    nop
   0x0000000001bd039c <+48>:    mov     w0, w3
   0x0000000001bd03a0 <+52>:    str     w0, [sp, #28]
   0x0000000001bd03a4 <+56>:    nop
   0x0000000001bd03a8 <+60>:    add     sp, sp, #0x20
   0x0000000001bd03ac <+64>:    ret
通过查阅前述的ARMv8指令集文档及搜索某些复杂指令,最后再结合arm架构下spinlock原理 (代码解读)_adaptiver的专栏-CSDN博客_spinlock实现原理中以下部分的说明,终于理解了上述函数的功能:
从而证明踩内存事件与该函数无关
遇到过的问题
-
assembly - What does NOPL do in x86 system? - Stack Overflow
-
amd64 - What is the meaning of movabs in gas/x86 AT&T syntax? - Reverse Engineering Stack Exchange
GDB
使用技巧
输出格式控制
1
2
3
set print pretty on
set print elements 0
set disassembly-flavor att |intel
进程相关
1
set follow-fork-mode child
源文件相关
1
2
set substitute-path /foo/bar /mnt/cross
directory /fw_dat/ #详情参见How to point GDB to your sources | There is no magic here
调试相关
使用h <command>查看帮助
堆栈
-
f
-
bt -2 full
-
info frame
线程
- thread apply
1
thread apply all bt
-
info threads
-
thread <id>
打印变量
-
ptype
-
p
-
x
-
inf locals
-
inf args
-
inf variables
修改变量
- set var
1
2
	(gdb) set var $count = 0
	(gdb) set var $foo = &{1.0}
set $list = (int *) malloc (10 * sizeof (int))
print {1,2,3,4}[2]
关于convenience variable的更多信息可参见Convenience Vars (Debugging with GDB)
流程控制
-
jump
-
return
-
finish
The return command does not resume execution; it leaves the program stopped in the state that would exist if the function had just returned. In contrast, the finish command (see section Continuing and stepping) resumes execution until the selected stack frame returns naturally.
断点操作
-
commands
-
silent
-
end
-
-
b lineno if xxx
-
condition x [if xxx]
-
ignore
观察点
1
2
3
watch
rwatch
awatch
汇编相关
输出控制
1
2
3
4
5
6
7
8
9
10
h disassemble
disassemble
disassemble /m
layout split
objdump -S
x /12i $pc
display/3i $pc
undisplay xxx
set  disassemble-next-line on
show disassemble-next-line
gdb - View Both Assembly and C code - Stack Overflow
Show current assembly instruction in GDB - Stack Overflow
流程控制
1
2
ni #nexti
si #stepi
寄存器
Registers (Debugging with GDB)
自定义命令
常用命令:
1
2
3
show user
help user-defined
define abc
例子:
1
2
3
4
5
6
7
8
9
define adder
  set $i = 0
  set $sum = 0
  while $i < $argc
    eval "set $sum = $sum + $arg%d", $i
    set $i = $i + 1
  end
  print $sum
end
详情参见Define (Debugging with GDB)
保存断点
above GDB 7.2 (2011-08-23)
save breakpoints <filename>
Save all current breakpoint definitions to a file suitable for use
in a later debugging session. To read the saved breakpoint
definitions, use the `source’ command.
below GDB 7.2 (2011-08-23)
1
2
3
4
5
6
7
8
9
10
11
12
13
14
15
16
17
18
19
20
21
.gdbinit:

define bsave
    shell rm -f brestore.txt
    set logging file brestore.txt
    set logging on
    info break
    set logging off
    # Reformat on-the-fly to a valid GDB command file
    shell perl -n -e 'print "break $1\n" if /^\d+.+?(\S+)$/g' brestore.txt > brestore.gdb
end
document bsave
  store actual breakpoints
end

define brestore
  source brestore.gdb
end
document brestore
  restore breakpoints saved by bsave
end
详情参见c++ - Getting GDB to save a list of breakpoints - Stack Overflow
使用案例
在N次循环时打断点
1
2
(gdb) set var $count = 0
(gdb) break file.c:888 if ++$count == 1000
计算函数耗时
1
2
3
4
5
6
7
8
9
(gdb) set var $start=(struct timeval *) malloc(sizeof(struct timeval))
(gdb) set var $end =(struct timeval *) malloc(sizeof(struct timeval))
(gdb) b fun1
(gdb) c
(gdb) call gettimeofday($start,0)
(gdb) b +20
(gdb) c
(gdb) call gettimeofday($end,0)
(gdb) p ((end.tv_sec*1000*1000+end.tv_usec)-(start.tv_sec*1000*1000+start.tv_usec))
可以使用define封装成一个gdb command,可参考:
1
2
3
4
5
6
7
8
9
define timeme
set $last=clock()
n
set $timing=clock() - $last
if $timing>$arg0
printf "***long***\n"
end
printf "%d cycles, %f seconds\n", $timing, (float)$timing / 1000000
end
gdb break if called from
遇到过的问题
-
c - Jumping to the next “instruction” using gdb - Stack Overflow
-
debugging - Return a value via a gdb user-defined command - Stack Overflow
-
gdb user-defined command if break while loop - Google Search
-
gdb - Dwarf Error: wrong version in compilation unit header (is 4, should be 2) - Stack Overflow:编译较新版本GDB即可
-
debugging - How can I make gdb save the command history? - Stack Overflow
推荐参考资料
构建系统
compile_commands.json
定义:JSON Compilation Database Format Specification — Clang 13 documentation
compile_commands.json是一个非常有用的文件,它长这样:
1
2
3
4
5
6
7
8
[
    {
        "command": "。。。",
        "directory": "。。。",
        "file": "。。。"
},
...
]
如何生成这个文件呢?对于cmake而言,只需传入一个额外的参数-DCMAKE_EXPORT_COMPILE_COMMANDS=ON即可
对于基于Makefile的构建系统,则需要安装辅助工具,例如bear:
安装方法如下(CentOS推荐从源码安装,且推荐编译旧版本,如2.1.5):
-
Installing Bear from a binary package
如何使用它呢?非常简单,只需在make命令前加上bear即可:
1
bear make
这样即可得到compile_commands.json
二进制分析
目标文件
.o文件
可执行文件
静态库
动态库
相关工具
binutils
使用如下命令即可获取该软件包中的所有命令:
1
rpm -ql binutils |grep bin/
下面只列举其中比较常用的
as
汇编命令。将汇编代码转换为目标文件(.o文件)
ar
打包命令。用于生成.a文件(静态库)
ld
链接命令。将多个.o文件链接成为一个.out文件(可执行文件)
nm
查看symbol的命令。用于查看elf文件的symbol
objdump
查看obj文件(.o, .a, .out, .so等)的信息
常用示例:
1
2
3
4
5
objdump -l -F -S -d a.out > a.s
objdump -M intel -d a.out >a.s
objdump -M amd-64 -d a.out >a.s
objdump -EB/EL -d a.out >a.s
objdump -I mcp/xxx sicuggio.bin
readelf
和objdump类似,只是更详细且不依赖于bfd库
strings
显示obj文件中的可打印字符
strip
删除obj文件中的标志
glibc-common
ldd
查看某个可执行文件依赖于哪些动态库。由于其可能执行该可执行文件,从而导致安全问题,所以man ldd中推荐使用objdump -p |grep NEEDED命令来代替
修订记录
| 修订时间 | 修订人 | 版本 | 说明 |
|---|---|---|---|
| TODO | wsxq2 | 1.0 | 初稿 |